 SpaceWatch.Global An independent perspective on space

by Valentin Eder

This article looks at the impact of mega-constellations to the collision risk in outer space using the results of a systemic approach to reducing the uncertainty of the ambiguity of actual developments based on conjunction analyses on the example of SpaceX’s Starlink using TLE data from space-track .
Data analysis by Space Analyses (Vienna) of about 1.63 billion conjunctions < 5km over the last 97 Days shows a set of developments that should enrich the actual discussions on Space Traffic Management (STM) and Space Environment Management (SEM). The systemic look to the conjunctions should bring answers where the collision risk is higher than in other ‘regions’ and shows current trends.
Avoidable and Unavoidable Conjunctions
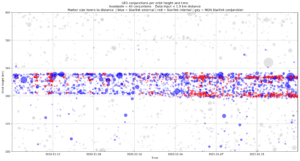
 The plot shows the conjunctions <1km for avoidable conjunctions in LEO for the past 94 days per orbit height. In blue the external and in red the internal Starlink conjunctions are shown. In outer space, there are conjunctions that are unavoidable (debris versus debris or any ‘non-piloted’ objects) and conjunctions that are possible to avoid where at least one of the objects can be moved (avoidable conjunctions). Note, there is no publicly available data on what types of an object have active propulsion systems but using the age and type of the object, an assumption can be made that only relatively new objects in LEO that are of a certain size are qualified as payload with propulsion.
Conjunctions and the Latitude
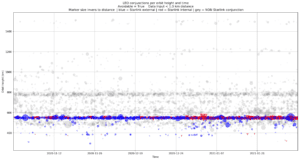
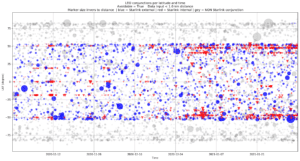 The graph shows all conjunctions of the Starlink constellation in red (internal) and blue (external) with all others avoidable conjunctions in grey in the background depending on latitude. The high-risk events within the given constellation are represented by the size of the bubbles (high risk is bigger size). The regularity of the internal conjunctions within the constellation appear as red lines in the same latitude. In the given data set the closest conjunction was between STARLINK-1206 and STARLINK-1618 as happened on the 2021-01-02.
LEO Orbital Lanes
 In addition, the concepts of a ‘traffic-lanes’ in outer space help to distinguish certain areas with different risk levels. The plot (Left) shows a zoom-in to the plot above to show the orbit lane of Starlink. These two main classifications build the frame to look on different aspects of conjunctions in a daily time frame. The data input is the publicly available TLE data from space-track and although have a limitation on the accuracy of single objects is used for long period analyses (~20,000 objects @ >10cm).
Involved Object Groups
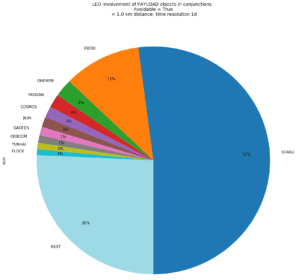 Next, is to look at the active satellites classified as payload and that it is assumed that these objects could avoid conjunctions.
The result is self-explanatory. More than 50% is connected to one US-based operator. This seems reasonable, as the number of space objects from this operator is, significant.
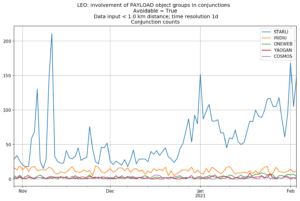 To have a deeper look into the conjunctions of these objects a time plot can help to understand the dynamics of the events.
Conjunction Probability
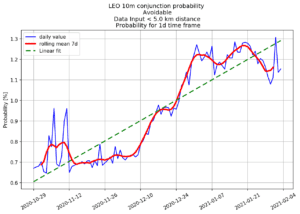 Taking a general view of the actual situation is to look at the probability of statistical conjunction < 10m, here named ‘system collision risk’ (based upon actual accuracy of the space object position). The distribution of the space objects to each-other gives an estimate of the risk. So not only the number of objects in the lane/area but also the relative position of all objects in the ‘swarm’ influences the collision risk.
The daily probability of a <10m conjunction for all orbits today is around 6.5% which means that statistically, each second week, two objects are <10m apart. The probability at the end of November 2020 was around 6.2%. The statistical time between two conjunctions <10m at the end of November was 1.5 Days longer than today. That means that the probability of conjunctions (and the probability of collisions) increases as the time between conjunctions gets shorter. The graph shows the daily ‘system conjunction probability’ in blue of the avoidable conjunctions, the running mean of 7 Days in red and the progression line in green.
Avoidable and Unavoidable Conjunctions
At this stage, the differentiation between avoidable and unavoidable conjunctions must be considered. Unavoidable conjunctions form a ‘natural growth’ and realistically nothing significant can be done against this type of conjunction. Removing some larger elements, such as, rocket bodies or for example, the ‘big fish’ like EnviSat, from the space system to reduce the risk of larger collisions.
Avoidable conjunctions where at least one of the two elements approaching each other can be moved are handled today with warnings (resulting in actions) and, in the given systemic look to the space environment, are handled as ‘artificial input’ to the system. So, in conclusion, very little can be done to reduce the probability growth in unavoidable events and for avoidable events, it is the responsibility of the actors or stakeholders to reduce growth and/or reduce the risk!
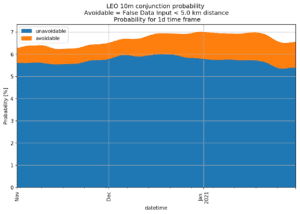 The above mentioned 6.5% probability split into avoidable and unavoidable shows that the significant increase from 6.2% to 6.5% is from avoidable conjunction results. The input of active satellites significantly increases the probability of conjunctions. The probability of conjunction from a satellite with an active propulsion system is increased, within 94 Days, by 69 % (from 0.7 to 1.2 points), whereas the natural growth is -3.6% (from 5.6 to 5.4 points). A satellite operator may consider the avoidable as a ‘low risk’ situation? This is only correct if operators know what is flying out there and they have (and use) their resources to do so. The given data is based on the TLEs that represent all items >10cm. Smaller items (known here as ‘system noise’) are not included in the above probability calculations. There are estimates of 600,000 to 800,000 of space debris items >1cm. The kinetic energy of a 1cm³ aluminium part with a speed of 14km/s represents the impact to 4.5kg steel impacted by an artillery shell at its relative speed. So, these small items can destroy or significantly damage any (dead or active) object in space and thus produce additional space debris of an unknown factor. If now this ‘noise’ (unknown small objects) is taken into the probability calculation the actual status can be multiplied by something between 28 and 38 (or the time gap between two <10m conjunction events as described above, divided by this factor). The factor between 28 and 38 is the relation between the number of parts >1cm and the number of parts >10cm.
Internal versus External Conjunctions Applied to Mega-Constellations
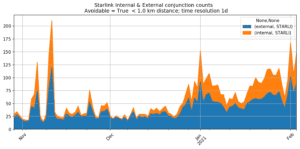 Using the conjunctions of Starlink as an example should answer the question about the portion of internal conjunctions (i.e., Starlink versus Starlink) and what other external conjunctions appear. In the stacked chart, it appears that internal conjunctions are only a smaller part of the total counts of all conjunctions <1km. Nevertheless, internal conjunctions seem to increase after the events of external types. The given interpretation asks the question: “What is the operation centre going to do in the event of a conjunction risk?”
It seems that as the operator tries to avoid the conjunction with an external object it then brings its own objects into risk! This seems to have an analogy to the well-known problem applied to autonomous driving cars if the old man or the young kid is the driver (The Trolley Problem)!
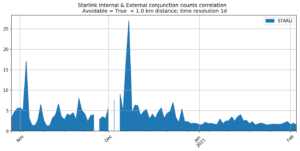 Can that be proved somehow? The plot (Left) shows the correlation between internal and external conjunction events. So, how many external conjunctions are needed to trigger internal conjunction?
Interestingly, the smaller the number in the chart means a higher impact of external conjunctions to the mega-constellation (Special Note: The right-hand side of the two plots).
Comparing the two plots the interpretation leads to a judgement that the number of external events also reduces the correlation. Again, that means that the given example of the Starlink Mega-Constellation shows the fragility of the system to an external ‘input’ and that the system itself is quite fragile!
A robust constellation would show no risky internal conjunctions and a low occurrence of external influence to internal conjunctions. It also shows that, in our example, the Starlink constellation appears as ‘stiff or inflexible’ network and does not operate like a swarm that enables a flexible and stable operation.
Data Analysis Conclusion:
In LEO orbits the natural growth (unavoidable conjunctions) leads that the risk in the space system decreasing per year in the range of about 10%. Whereas the risk from the ‘artificial input’ (avoidable conjunctions) doubles every 3 months which results to a total risk growth of <10 m conjunctions of some 26% per year!
A prediction of the actual conjunction risk growth by begin 2032 to one single, daily <10m conjunction and by mid of 2034 it doubles to two, daily <10m conjunctions.
The risk increase is dominated by one single mega-constellation responsible for >50% of the conjunctions of the active satellites.
In MEO orbits the collision risk seems to be moderate with 10 conjunctions <1km in three months.
In GEO orbits (especially in the safe belt) also appears to be moderate as in three months, 4 conjunction events of <1km occurred but all are avoidable. Nevertheless, even one single collision would pollute the GEO belt unusable for decades.
The data analysis has shown how fragile the Starlink constellation is today and the resulting significant risk of the possibility of a chain reaction of collisions.
Note:
- All the mentioned figures are based on publicly available data assumed for items <10cm.
- The unknown items <1cm increases the collision risk by a factor between 28 and 38!
To conclude:
- Any significant collision of two satellites within in the ‘area of influence’ of Starlink’s constellation
…or
- A collision within the Starlink’s constellation
…would inevitably lead to a situation of the instability of the constellation with the resulting collision chain reaction.
In addition, the plots give an indication of saturation levels within an ‘orbit lane’.
Thus, if traffic saturation is high, any system disturbance has a significant possibility of impacting the total system
The above analysis represents the following…
- An example of daily long-term sustainability monitoring giving national authorities the possibility to execute the compliance of national space laws.
- It reduces the uncertainty by risk transparency based on empiric data.
- Highlights risk transparency of mega-constellations to investors in space activities.
- Last but not least, it contributes to the implementation of the UNOOSA LTS guidelines.
Closing Remark with Request for Falsification
The results shown in this paper are those collated by Space Analyses and are considered as best of one’s knowledge and belief. Interpretations given, using these results, represent the personal opinion of the Author.
Never the less we propose falsification of the results according to OECD standards with a special note to the SpaceX’s Starlink team as they have their own data and findings. The Author would warmly welcome a disproof of all the above-mentioned findings in open and public discourse.
Space Analyses (Vienna, Austria), founded in 2014 by Valentin Eder, digs into the convergence of Big Data with the Space-Time Continuum and applies the results to domains such as Satellite Communication and Space Debris Management. Space Analyses develops holistic data analytics solutions for Satellite Payload and Spacecraft Operations. With its comparably unique combination of Earth Observation, RF monitoring, Satellite Operations and SW Development know-how Space Analyses is a valued partner of Satellite and Satellite Network Operators.